Paypay:Standard deviation diagram.svg

Size of this PNG preview of this SVG file: 400 × 200 nga mga pixel. Iba nga mga resolusyon: 320 × 160 nga mga pixel | 640 × 320 nga mga pixel | 1,024 × 512 nga mga pixel | 1,280 × 640 nga mga pixel | 2,560 × 1,280 nga mga pixel.
Orihinal nga paypay (SVG nga fayl, ginbabanabanahan nga 400 × 200 nga mga pixel, kadako han fayl: 17 nga KB)
Dalikyat nga pulong
| Tigtulidong |
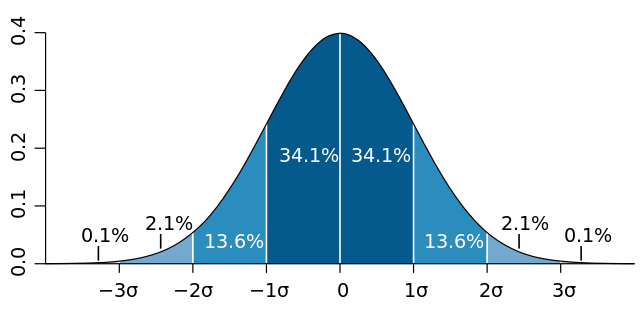
English: Normal distribution curve that illustrates standard deviations. Each band has 1 standard deviation, and the labels indicate the approximate proportion of area (note: these add up to 99.8%, and not 100% because of rounding for presentation.)
Français : Courbe de distribution normale montrant l'écart type. Chaque bande verticale a une largeur d'un écart type et les pourcentages indiquent leur valeur approximative rapportée à la population totale. Note : du fait des arrondis, le total est de 99,8 % au lieu de 100%. |
| Petsa | |
| Ginkuhaan | Kalugaringon nga buhat, based (in concept) on figure by Jeremy Kemp, on 2005-02-09 |
| Awtor | M. W. Toews |
| Other versions |
|
.svg)
Palilisensya:
This file is licensed under the Creative Commons Attribution 2.5 Generic license.
- Talwas ka:
- para han pagpasaro – para han pagkopya, pagpakalat ngan pagpadangat han buhat
- para han pagremix – pag-adapt han buhat
- Ha ilarom an masunod nga mga kondisyon:
- attribution – Kinahanglanon mo tagan hin kaangayan nga credit, paghatag hin sumpay ngadto ha lisensya, ngan igbutang an imo ginbag-ohan nga binuhat. Puydi mo ini buhaton ha bisan ano nga resonable nga pamaagi, pero diri nimo pagawson nga an naghatag hin lisensya nag-eendorso ha imo o ha imo paggamit.
Kaagi han paypay
Pidlita an adlaw/oras para makit-an an fayl nga naggawas hito nga oras.
| Pitsa/Oras | Thumbnail | Mga dimensyon | Gumaramit | Komento | |
|---|---|---|---|---|---|
| waray pa kasasapawi | 02:06, 15 Enero 2015 | | 400 × 200 (17 nga KB) | GliderMaven | Average is now zero not mu |
| 11:08, 7 Abril 2007 |  | 400 × 200 (14 nga KB) | Petter Strandmark | == Summary == Standard deviation diagram, based an original graph by Jeremy Kemp, in 2005-02-09 [http://pbeirne.com/Programming/gaussian.ps]. This figure was started in R using: <pre> x <- seq(-4,4,.1) plot(x,dnorm(x),type |
Mga Sumpay
An mga nasunod nga mga pakli nasumpay hini nga paypay:
Global file usage
An masunod nga iba nga mga wiki in nagamit hini nga file:
- Paggamit ha af.wikipedia.org
- Paggamit ha ar.wikipedia.org
- Paggamit ha ast.wikipedia.org
- Paggamit ha as.wikipedia.org
- Paggamit ha ba.wikipedia.org
- Paggamit ha be-tarask.wikipedia.org
- Paggamit ha bg.wikipedia.org
- Paggamit ha bn.wikipedia.org
- Paggamit ha bs.wikipedia.org
- Paggamit ha ca.wikipedia.org
- Paggamit ha cbk-zam.wikipedia.org
- Paggamit ha cs.wikipedia.org
- Paggamit ha cv.wikipedia.org
- Paggamit ha cy.wikipedia.org
- Paggamit ha dag.wikipedia.org
- Paggamit ha da.wikipedia.org
- Paggamit ha de.wikipedia.org
- Paggamit ha de.wikiversity.org
- Paggamit ha el.wikipedia.org
- Paggamit ha en.wikipedia.org
Kitaa durudamo nga global usage hinin nga file.